Data Processing Methodology
A comprehensive depiction of how VELSTROM extracts, processes, and transforms raw satellite imagery, elevation data, and field measurements into actionable geospatial intelligence. From Sentinel-2 multispectral tiles to calibrated GeoTIFF index rasters, every step is reproducible, auditable, and scientifically rigorous.
Geospatial Data Products
Each image below represents an actual methodology output from our processing pipeline — from raw Sentinel-2 satellite composites to derived spectral indices, elevation models, groundwater analyses, and classified vector overlays. Click any image to expand.
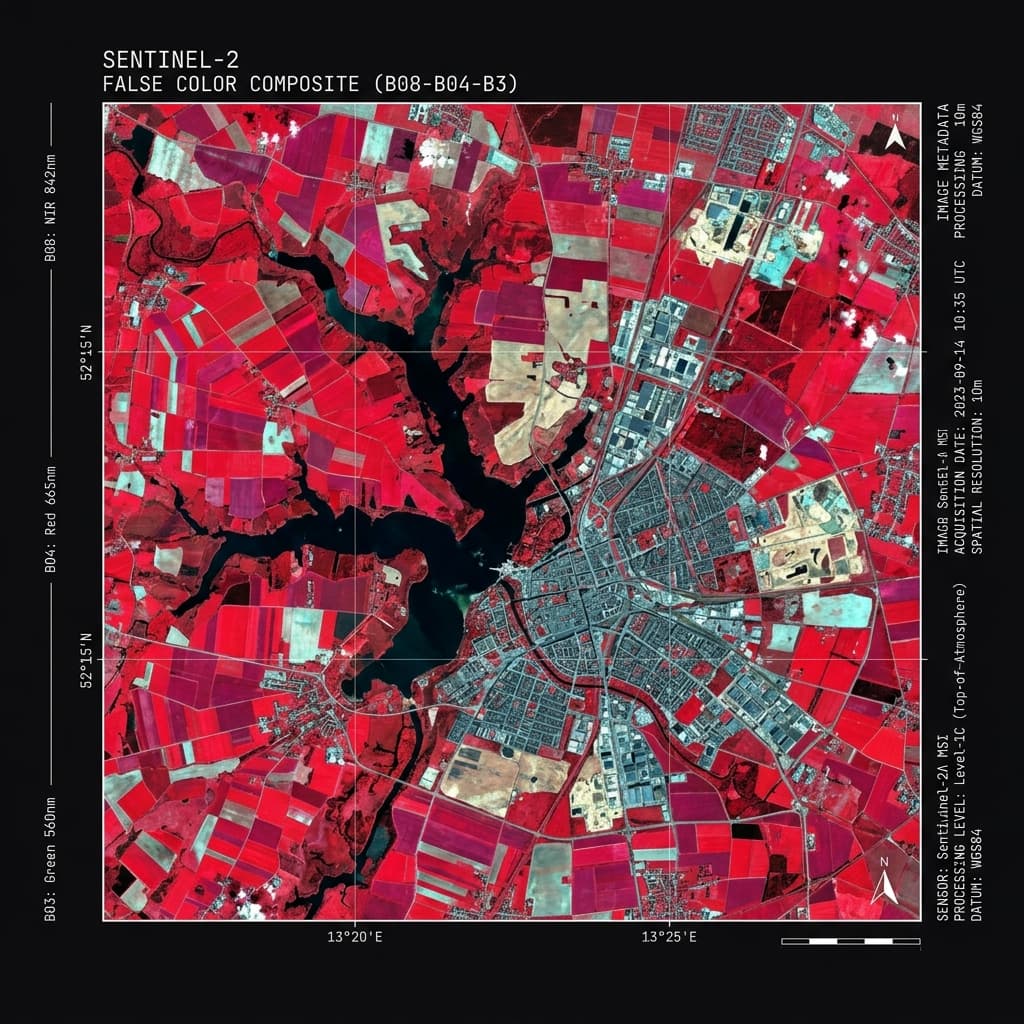
Sentinel-2 False Color Composite
B8-B4-B3 false color rendering highlighting active photosynthetic activity. Vegetation appears in vivid magenta due to high Near-Infrared (NIR) reflectance, while water bodies absorb NIR and appear dark blue. Bare soil and urban areas reflect high SWIR/Red and present as cyan. This composite serves as the foundational Level-2A raw satellite tile before atmospheric correction and index computation, enabling immediate visual discrimination of land cover types.
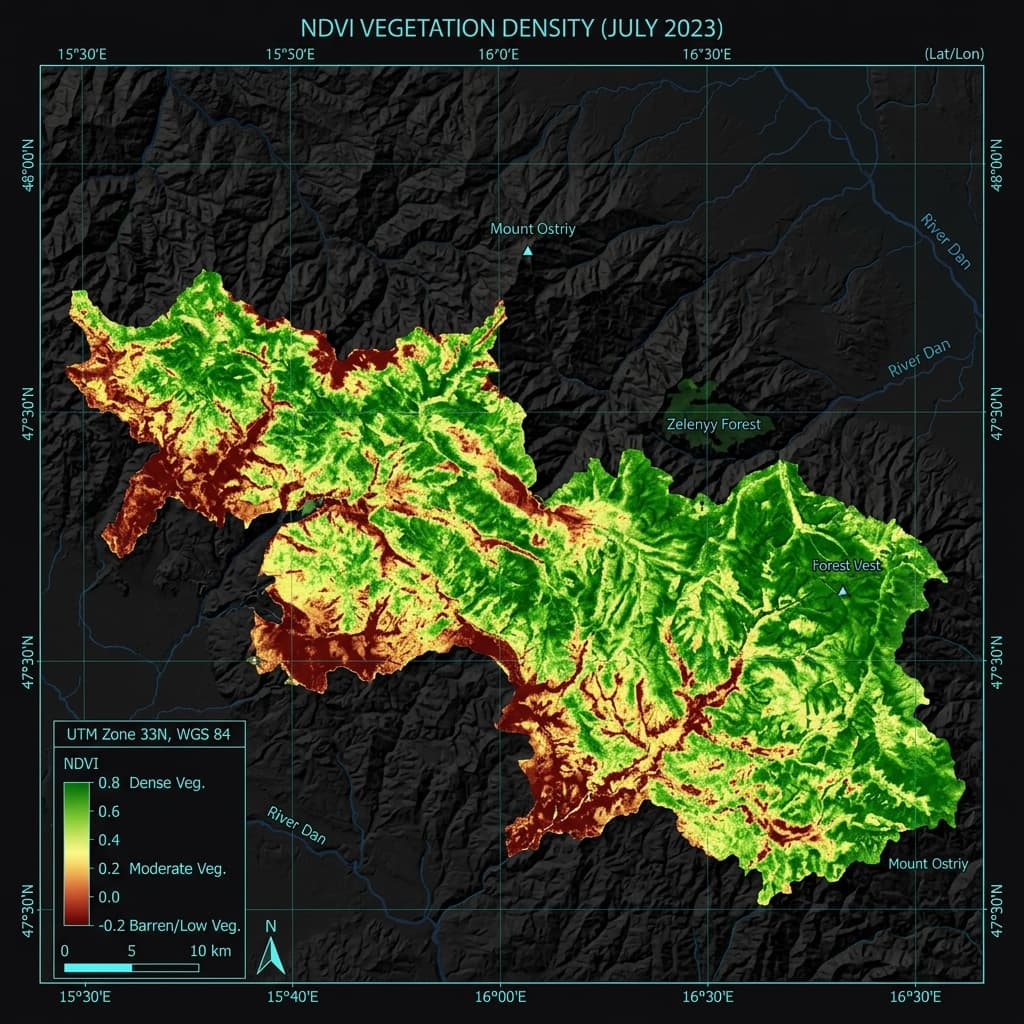
NDVI Vegetation Density Map
Normalized Difference Vegetation Index GeoTIFF output mapping the exact density of green biomass. Calculated as (NIR - Red) / (NIR + Red), the resulting gradient visualizes barren terrain or degraded land in reds and oranges, while dense, healthy canopy saturates in deep greens. This continuous raster dataset forms the backbone for identifying crop stress, drought impact, and baseline carbon stock potential across vast agricultural landscapes.
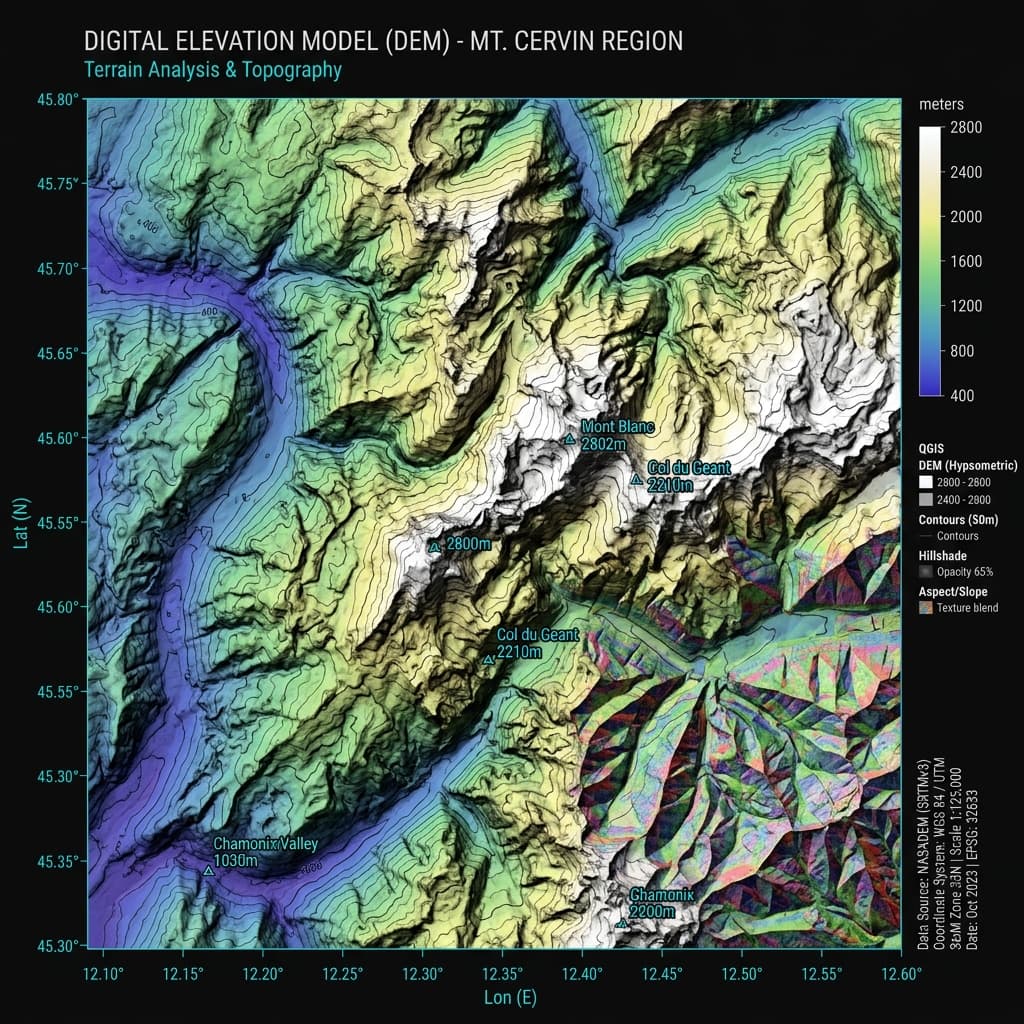
Digital Elevation Model (DEM)
High-resolution SRTM-derived Digital Elevation Model (DEM) with multi-directional hillshade overlay, topographic contour lines, and hypsometric tinting. This spatial layer is critical for deriving terrain slope, surface aspect, and solar irradiance potential. The elevation data natively integrates into our hydrological models to simulate water runoff, accumulation zones, and flood risk vulnerabilities.
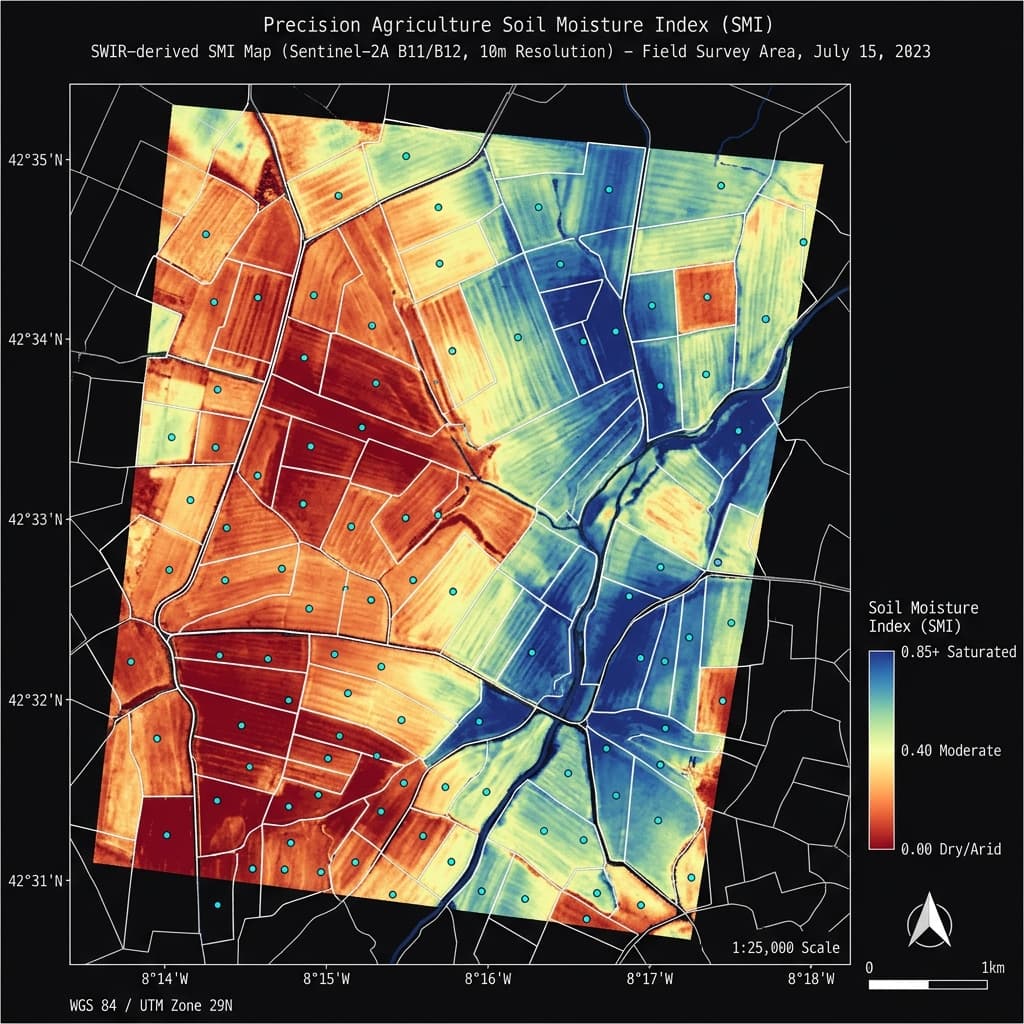
Soil Moisture SWIR Analysis
Short-Wave Infrared (SWIR) derived soil moisture index mapping field-level hydration variations. Water strongly absorbs SWIR radiation, allowing us to map moisture gradients from critically dry soils (red/orange) to heavily saturated zones (blue). Overlaying this index with field sampling coordinates helps calibrate our machine learning models to detect early onset agricultural droughts before they manifest physically in crop yields.
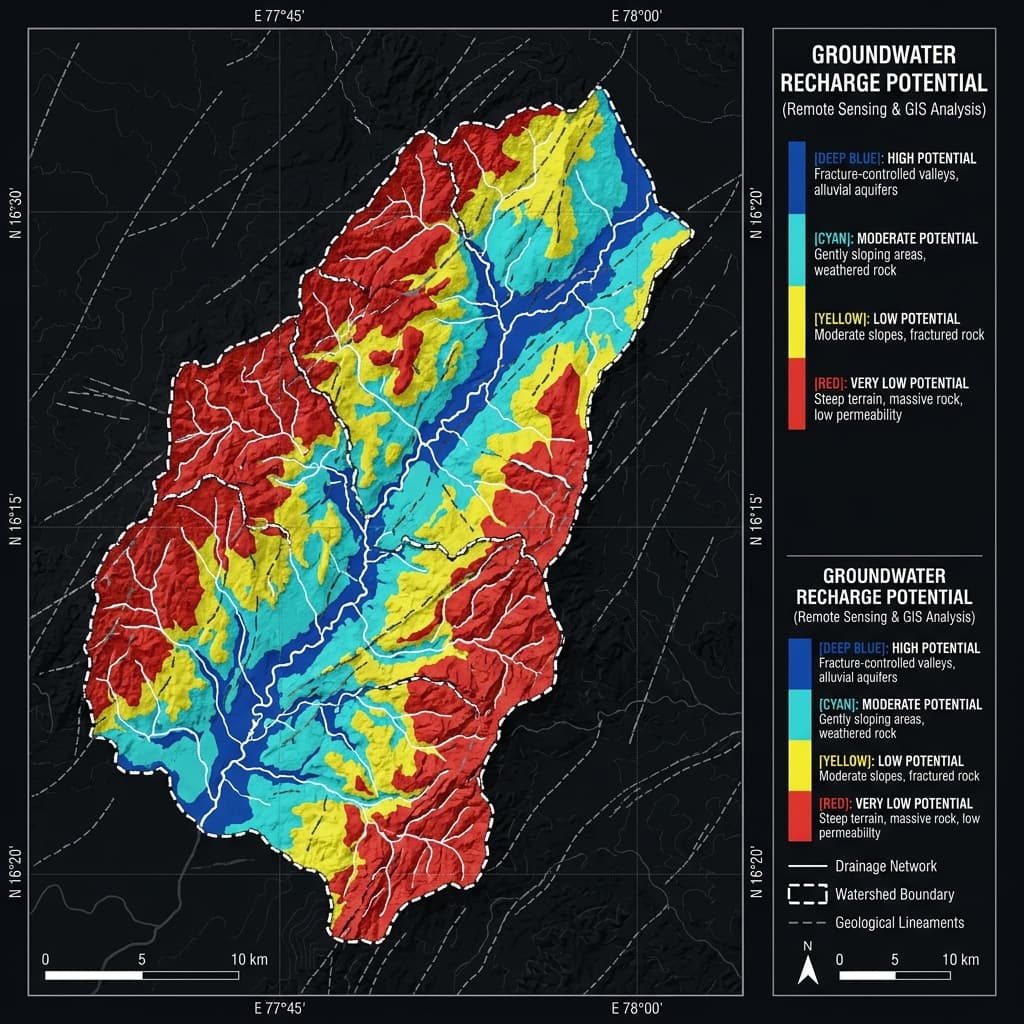
Groundwater Potential Zone Map
Multi-criteria hydrogeological analysis aggregating lineament density, drainage network proximity, topographic slope, and subsurface lithology. By feeding these variables into a weighted spatial overlay, we delineate high-probability groundwater recharge zones. This vector intelligence is paramount for deploying sustainable irrigation infrastructure, managing aquifer depletion, and auditing water-security projects.
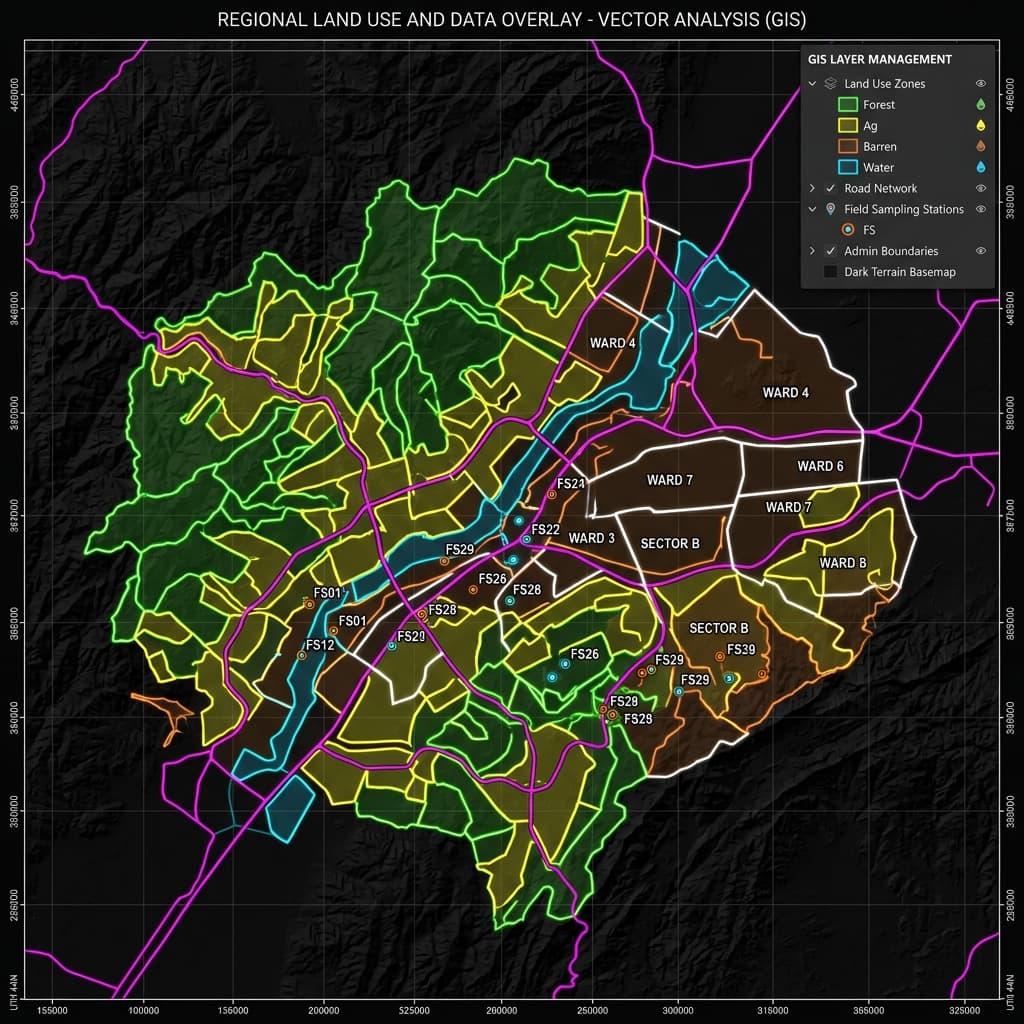
Vector Shapefile & Land Classification
Comprehensive GIS vector overlay rendering precise land-use classification polygons, demarcated administrative boundaries, rural road networks, and geolocated field sampling stations onto a dark cartographic basemap. This multi-layered shapefile environment allows our platform to spatially query attributes, compute zonal statistics for individual farm plots, and seamlessly link ground-truth sensor telemetry to orbital datasets.
Time Series Analysis & Soil Fertility
We continuously monitor vegetation dynamics across agricultural regions in India by tracking multi-spectral vegetation indices over time. The spatial pixel data is extracted into continuous time-series graphs and exported as structured .csv datasets, capturing the exact historical rhythm of planting, growth, and harvest cycles.
NDVI Long-term Time Series
This graph illustrates the long-term temporal pattern of the Normalized Difference Vegetation Index (NDVI) across several years in Hoshangabad, Madhya Pradesh. The rhythmic peaks and troughs precisely map the agricultural crop cycles, where peaks indicate peak vegetation vigor just before harvest, and troughs denote bare soil post-harvest. These raw data points are extracted from pixel-level satellite observations into continuous .csv formats for algorithmic ingestion.
NBSI Time Series – Post-Harvest
A seasonal plot of the Normalized Bare Soil Index (NBSI). By monitoring the cyclical spikes during harvest periods, we can identify exactly when and for how long the soil is exposed to the elements. These temporal signatures, extracted as .csv datasets, are crucial for understanding land degradation risks and soil health vulnerabilities between planting seasons.
EVI Seasonal Growth Trajectory
The Enhanced Vegetation Index (EVI) time series tracks the distinct growth trajectory and vegetation phenology across multiple monsoon seasons. By converting spatial pixel values into longitudinal .csv time series data, we capture the subtle atmospheric-corrected nuances in biomass accumulation, providing a high-fidelity historical rhythm of crop performance.
Machine Learning Ingestion
The extracted time-series .csv data serves as the foundational input for our predictive infrastructure. Rather than relying on single-point-in-time satellite passes, our machine learning architectures analyze the entire longitudinal pattern of these indices. By learning the temporal signatures—such as the duration of bare soil exposure, the amplitude of peak biomass, and the frequency of crop rotation—the algorithms can predict subtle changes in soil organic carbon and broader soil fertility metrics over time. This approach transforms historical vegetation rhythms into highly accurate, forward-looking insights without human bias.
Data Processing Architecture
Our six-stage pipeline transforms raw satellite passes into calibrated, validated geospatial intelligence products. Every stage produces auditable intermediate outputs in standard geospatial formats.
Satellite Data Acquisition
Raw Level-2A atmospherically corrected tiles are ingested from ESA Copernicus Open Access Hub. Sentinel-2 provides 13 spectral bands at 10–60m resolution with a 5-day revisit cadence. Landsat-8/9 OLI and Sentinel-1 C-band SAR supplement the optical data for all-weather monitoring.
Elevation & Terrain Extraction
SRTM 30m and Copernicus GLO-30 DEM elevation data is processed to derive slope, aspect, hillshade, Topographic Wetness Index (TWI), and curvature layers. These terrain derivatives are fundamental co-variates for hydrological modelling and site suitability analysis.
Spectral Index Computation
Multi-temporal vegetation, water, and soil indices (NDVI, EVI, NDWI, SAVI, NBSI, NBR2) are computed per 10m pixel cell. Temporal composites aggregate 90-day windows to suppress cloud contamination and produce gap-free continuous index time-series.
Groundwater & Hydrology Mapping
Hydrogeological analysis integrates lineament extraction from SAR imagery, drainage density mapping, slope classification, and lithological overlays to delineate groundwater potential zones. NDWI and TWI layers are cross-referenced with well log records for calibration.
Vector & Shapefile Processing
Administrative boundaries, field parcel polygons, road networks, and sampling station points are managed as ESRI Shapefiles and GeoJSON vectors. Zonal statistics extract per-parcel mean/max/min spectral values from raster stacks for field-level analysis.
ML Inference & Validation
Gradient boosting ensemble models, calibrated against 72 deep-core physical soil assays, predict Soil Organic Carbon (SOC), biomass density, and ecosystem health metrics. Spatial leave-one-block-out cross-validation with SHAP explainability ensures scientific rigour.
Index Computation Library
Every vegetation, water, and soil index is computed per 10m pixel from Sentinel-2 L2A atmospherically-corrected reflectance bands. Below are the precise mathematical formulas and their geospatial applications.
(B08 − B04) / (B08 + B04)Measures photosynthetic activity and chlorophyll density. Values above 0.4 indicate healthy vegetation canopy; below 0.2 suggests bare soil or water stress.
2.5 × (B08 − B04) / (B08 + 6×B04 − 7.5×B02 + 1)Corrects atmospheric and canopy background noise in dense vegetation regions. More sensitive than NDVI in high-biomass tropical zones.
(B03 − B08) / (B03 + B08)Detects open water surfaces and estimates leaf water content. Positive values indicate surface water; used for flood mapping and irrigation tracking.
((B08 − B04) / (B08 + B04 + L)) × (1 + L)Minimises soil brightness influence in sparse vegetation areas using a soil correction factor (L = 0.5). Critical for arid and semi-arid regions.
(B11 + B04 − B08 − B02) / (B11 + B04 + B08 + B02)Identifies exposed soil and desertified terrain. Higher values indicate bare soil; used for land degradation monitoring and urbanisation tracking.
(B11 − B12) / (B11 + B12)Highlights post-fire burn severity and soil organic matter changes using SWIR spectral contrast. Used for wildfire damage assessment.
Sentinel-2 Band Reference
The 13 spectral bands captured by the Sentinel-2 MSI instrument, spanning visible light through shortwave infrared. We primarily utilise 6 critical bands for our index computations.
Geospatial File Formats
All outputs adhere to OGC open standards. Below are the primary formats used across our raster and vector data products.
GeoTIFF
Geo-referenced raster format with embedded CRS, resolution, and band metadata. Primary output for all spectral indices, elevation models, and SOC predictions.
ESRI Shapefile
Industry-standard vector format for polygons (field boundaries, administrative zones), polylines (drainage, roads), and point features (sampling stations).
GeoJSON
Lightweight, web-compatible JSON-based vector format used for API exchanges, web-map rendering, and inter-platform data sharing.
NetCDF / HDF5
Multi-dimensional array formats for climate reanalysis datasets (ERA5), temporal stacks, and satellite Level-1 products before processing.
GeoPackage
SQLite-based OGC open standard combining raster tiles and vector features in a single portable file. Replacing legacy .SHP for modern workflows.
Cloud-Optimized GeoTIFF
Internally tiled and overviewed GeoTIFF enabling efficient HTTP range-request streaming. Powers our cloud-native STAC catalog for on-demand spatial queries.
Satellite Platforms & Data Providers
Satellite Platforms
Elevation & Ancillary Data
Processing Tools & Frameworks
GIS & Remote Sensing
Machine Learning
Cloud Infrastructure
Data Integrity & Validation
Every processed dataset undergoes rigorous multi-stage quality checks before being deployed for decision-making or published to our geospatial platform.
Cloud Masking
SCL (Scene Classification Layer) from Sentinel-2 L2A removes cloud, shadow, and cirrus pixels before index computation. Temporal infilling reconstructs gaps.
Atmospheric Correction
L2A processing applies Sen2Cor atmospheric correction converting Top-of-Atmosphere radiance to Bottom-of-Atmosphere reflectance values.
Spatial Cross-Validation
Leave-one-block-out (LOBO) with 5km block size prevents spatial autocorrelation leakage in ML model evaluation. Reports R², RMSE, and bias per fold.
Physical Ground-Truth
72 high-fidelity deep-core soil assays, processed in accredited laboratories, calibrate and validate all model predictions against physical reality.
Coefficient of determination on held-out spatial blocks
Root mean square error of SOC concentration prediction
Systematic prediction bias across all validation folds
Access the Velstrom Platform
View live spectral indices, download processed GeoTIFF rasters, and interact with our geospatial data products directly on our cloud platform.